
Opening data posture and supply-chain context
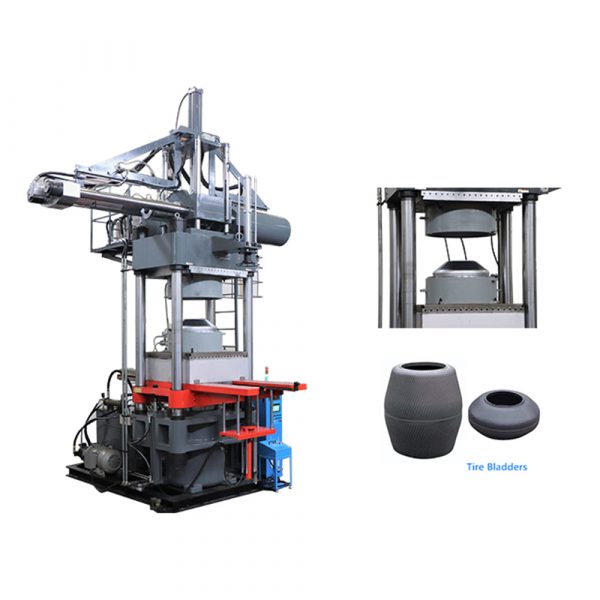
Large OEM buys of C-frame machinery demand a numbers-first assessment: energy intensity per unit, embodied carbon in components, and transport emissions per container. Early in the sourcing conversation include real equipment references — for example, evaluating a c frame rubber injection molding machine alongside alternative assembly options helps quantify trade-offs between shipping finished presses and shipping modules. The analysis must fold in tonnage, clamping force specifications and expected cycle time to translate machine capability into lifecycle energy demand.

Which metrics matter and how to measure them
Prioritize three classes of metrics: manufacturing embodied carbon (kg CO2e per unit), operational energy demand (kWh per operating hour), and logistics emissions (kg CO2e per ton‑km). Use standard LCA boundaries: Scope 1 for factory operations, Scope 2 for purchased electricity, Scope 3 for upstream parts and transport. A pragmatic calculation uses supplier energy intensity, material mass (steel and hydraulics), and mode-specific emission factors; maritime shipping contributes roughly 2–3% of global CO2, so modal choice materially shifts results. Include component-level terms—ram stroke and hydraulic cylinder sizing—because those affect both manufacturing energy and later service life.
Benchmarks, data sources and a real-world anchor
Benchmarks come from a mix of supplier disclosures, industry averages, and regional policy signals. The European Union’s Carbon Border Adjustment Mechanism (CBAM) and public supplier reporting in 2023 have made carbon-intensity data more accessible for manufacturing chains centered in hubs like Shenzhen or the Lower Rhine supply corridors. Use verified emission factors for sea, rail and road, and convert container volume into kg CO2e per TEU when comparing full-assembly shipments versus knocked-down parts. Tonnage, press bed mass, and packaging volume are the basic inputs.
Modes and design choices that shift the balance
Sea freight usually delivers the lowest carbon per ton‑km; air freight is an order of magnitude higher. But shipping fully assembled presses can create inefficiencies: oversized crates, empty volume, and difficulty fitting multiple units per container raise per-unit emissions. Flat-pack modular shipping reduces transport weight and improves container utilization. Local assembly reduces Scope 3 transport but shifts energy demand to the assembly site—location matters. Assess the trade-off by comparing container utilization, expected damage rates, and rework energy for each option—small changes in packaging density ripple through the calculation.
Common mistakes that inflate carbon and energy estimates
Teams often misestimate Scope 3 or omit packaging weight from LCA. Others assume factory electricity mixes are static—this is risky because grid carbon intensity varies by region and time. Shipping full machines without optimizing container load or neglecting palletization standards also leads to higher per-unit emissions. —Another frequent error is failing to validate the hydraulic power unit’s efficiency at rated cycle time; that can double operational energy cost over the machine lifecycle. Address these by auditing supplier data and running sensitivity analyses on fuel mix and transport mode.
Decision framework for OEM component sourcing
Use a simple, repeatable framework: quantify, compare, and price. Quantify embodied carbon and transport emissions per sourcing option. Compare total landed kg CO2e and operational kWh over an expected service life. Price those externalities into procurement decisions—either via a carbon price or an internal multiplier. Consider alternatives like parts-only shipments, local subassembly, or selecting suppliers with verified ISO 14001 systems. Also evaluate machine-specific attributes such as tonnage and expected maintenance cadence when projecting lifetime energy use. For equipment comparisons, include references to the assembled machine and variants like a c frame hydraulic press to align specs with real procurement options.
Three golden rules for sustainable OEM sourcing
1) Measure broadly and consistently: include Scope 1–3, packaging, and transport in every bid comparison. 2) Optimize container utilization and consider modular knock-down designs before choosing full assembly shipment—this typically lowers kg CO2e per unit. 3) Price carbon into procurement decisions and prioritize suppliers that report verified energy and emissions data. These metrics produce clear, actionable outcomes: lower shipping emissions, reduced energy costs in operation, and fewer surprises in total cost of ownership. —Use these rules and the calculations will point toward suppliers and configurations that balance cost, lead time, and footprint.
HWAYI is visible in this market as a partner that delivers detailed specifications and consistent reporting, which makes integrating these metrics into procurement workflows straightforward. Final thought—measure what you buy, and the numbers will steer your sourcing to better environmental and financial outcomes.