Introduction: When the Label Meets the Queue
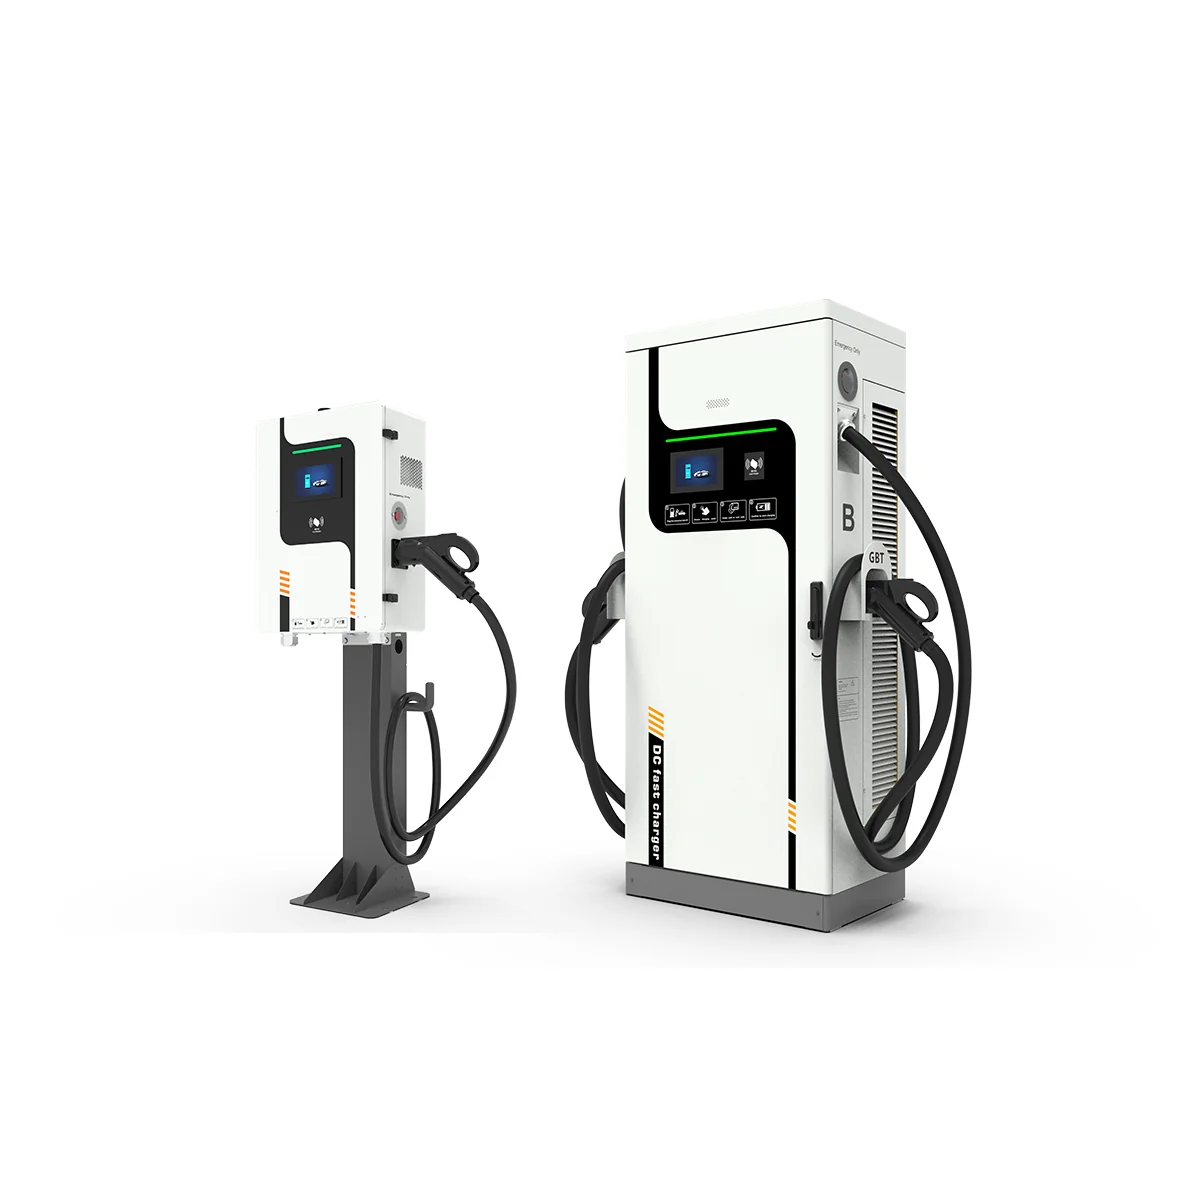
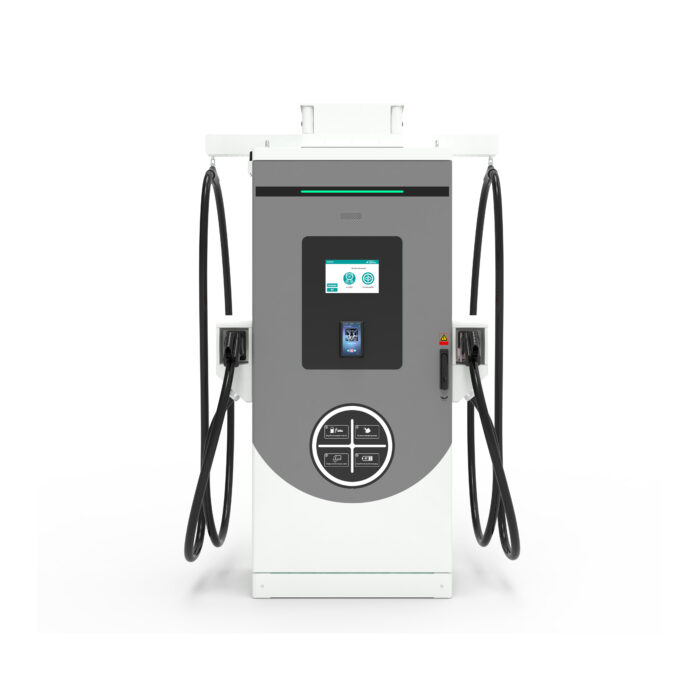
Bold claim: Kilowatts on the sticker do not control the line at the site. A 120kw EV charger sounds fast; the driver expects a short stop. At a busy forecourt at 18:10, five cars arrive within six minutes. Two bays are free, two are ramping, and one pack is cold. The super fast charging station 320 looks ready, but session power swings between 48 kW and 110 kW. The reason is not magic. It is control logic, power converters, and how edge computing nodes share current across stacks. You see the average wait go from 6 minutes to 17 minutes. That is data you can feel. So, the question: is “120 kW” the right target, or is the control strategy the real spec (and the one people judge)? Next, we go one layer deeper.
In Part 1, we compared headline speed with typical charge curves. Here, we map the gap between spec and street. We keep it simple and precise. We describe where time leaks, why ramps stall, and where heat steals power. We also show how site logic can fix more than raw kilowatts. Short, clear, and practical—let’s move.
Hidden Pain Points the Spec Sheet Hides
Where does the time go?
Many users blame the bay. Often, the bottleneck is elsewhere. Vehicles throttle early. Packs are cold. Cables warm up. Thermal derating kicks in. Sessions pause on handshake retries. Look, it’s simpler than you think: the station is a small plant. It needs stable control and clean flows. If OCPP 1.6 messages lag, billing waits add seconds at start and end—funny how that works, right? If harmonic distortion rises under load spikes, the site controller pulls back to stay compliant. Each event is small. Together, they turn “120 kW” into “feels slow.”
There is also fairness logic. When two cars share a cabinet, the DC bus must split current. If the algorithm favors the first car, the second sees a sag. Users call it “slow.” What they miss is the control mode. Is it peak-skewed or average-stabilized? The first feels great for one driver, poor for the next. The second feels decent for both. And this is the core pain point: people want predictable time, not just a big number. A station that holds 90–110 kW steady for longer beats one that spikes to 120 then drops. Plain and simple.
Comparative Outlook: Control Methods That Change Real Speed
What’s Next
New stations change the game by design, not only by size. SiC-based power stages (wide-bandgap semiconductors) cut losses and heat, so less thermal roll-off. Modular rectifiers allow cabinet-level current orchestration. A liquid cooling manifold keeps cable temps flat. And the site brain does more: it predicts car taper from state-of-charge and temperature, then schedules power to keep each bay steady. This is “process control” for curbside power. In practice, a smart 120 kW can outpace a noisy 150 kW. Compare this with the 160KW EV charging station, which adds headroom for peak, but still wins or loses on control loops, not digits. The lesson: stable delivery beats burst delivery (most days).
Summing the path forward: prioritize sustained power windows, not just peak. Favor cabinets that maintain low THD and a high power factor under dynamic load. Choose platforms that log micro-events and self-tune—predictive control, not reactive throttling. Advisory close: when you compare options, use three checks. One, verify sustained kW at 20–60% SOC over 10 minutes, per bay, at 35°C ambient. Two, confirm site-level uptime SLA with MTTR targets under 2 hours (spares on-site matters). Three, demand grid compliance across load steps: THD under 5% and no surprise trips. Do this, and queues shrink. People feel the change—even if they cannot name the isolation transformer or the firmware build—funny how that works, right? In short, control wins the day, then power scales. winline EV charger